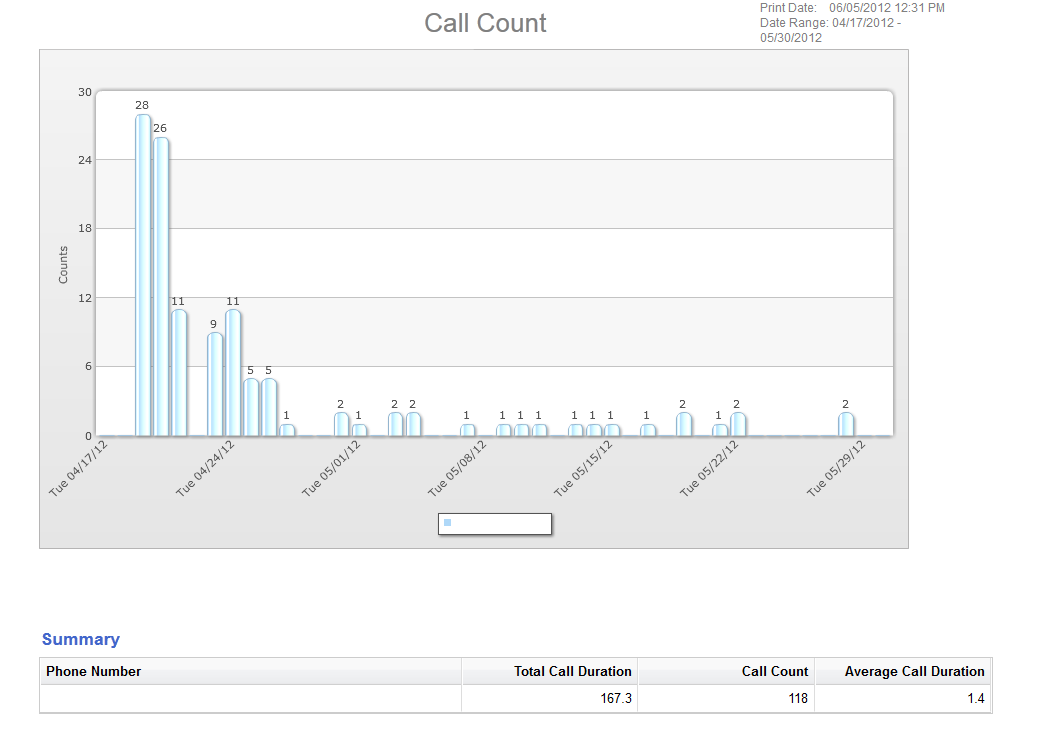
Here’s a call tracking report from a recent 99¢ yellow letter campaign. We sent out 500 letters on a Monday and the phone started ringing on Thursday. On 500 letters there were a total of 118 phone calls after 6 weeks, a response rate of 23.6%. That’s a little higher than our average response of 5-15%, and it’s important to note that if all of those calls came in at the same time it could be overwhelming.
The graph below is a great example of the call flow for a campaign. It shows how lots of calls come in the first couple days, then the calls slow down a little, and then they trickle in after that. In this campaign 55% of the calls came in the first week, 26% came in the following week, and the remaining 19% came in over the following 4 weeks.
It’s also a good illustration of the shelf life of yellow letters. When people receive a yellow letter they may call right away, but if they don’t, they may hold onto it and then call a week, a month, or even longer after the letters were sent out. Click the chart below to expand it.
